The exploration of our legal database lead us to consider a specific analysis, gender based, on Judge’s composition.
How many of the judges into Genoa’s legal court are women? And, this statistic respect the same average percentage on national level?
In Italy, women are allowed to become Judges into legal courts just from 1963 when a 1919’s law, that excluded them to fulfill public offices and to exercise jurisdictional function, was finally erased.
After the Constitution of 1948 – that establish a general principle of equality and non-discrimination based on gender – we still have to wait 12 years for a specific sentence by Constitutional Court (sent. 33/60) and 3 more years for a law (L. 66/63) that definitely open doors to women in judiciary.
After 58 years by the first open-to-women call for judges, when just 8 woman (7%) passed, things are really changed.
Since 1996 every call has been passed more by women than men and from 2015 the percentage of woman over the total of judges in Italy overtake the men’s.
Indeed, according to a research of Superior Council of Magistrary‘s statistical office, over a total of 9787 judges 4479 are men (46%) while 5308 (54%) are women with a significant difference about the average age: 51 years for men, 47 for women.
This data confirm the trend we have found on our specific gender based analysis on Genoa legal court.
In fact, over a total of 99 judges, 60 are women and 39 are men.
(Data changed if we consider different type of documents each time: “D” for “Decrees”; “O” for “Ordinances”; “S” for “Sentences/Judgments. You can use the specific filter on the graphic below).
In the graphic below you can observe the percentage of female and male Judges in our legal database and how it changed during the years considered.
Then, we use the disaggregated data by gender to analyze the quantity of judical documents redacted respecitvely by female and male judges during the years.
As we can see in the graphic below, there is always a positive trend for female judges over the male and the difference became consistent if we focus just on judgments, instead of the decrees and ordinances.
(You can use the filter to isolate the years range and the documents type. For further Information read this).
Using the classification we have previously created to identity specific subjects of matter into legal documents, we can see if there is any particular tendency moving from women to men about the themes they are called to resolve.
As we decided to separate data by type of legal documents, the main differences could be observed, again, especially for judgments (which is also the most significant class).
For female Judges the principal subjects are two: family rights (+34%) and obbligations and contracts controversies (+31%).
For male Judges the main application field is obbligations and contracts controversies (+37%) while the remain percentage is divided equally for all other subjects.
Now we can discuss deeper about the probability of having a Judgment for family related subject respectively by a female or male Judge.
In the first pie chart, switching on “Sentences” we saw we have a 59/41% of probability, for female and male respectively.
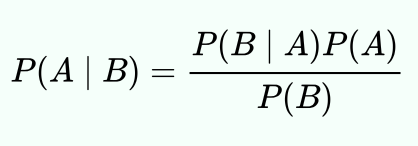
But, according to Bayes’s theorem we are in front of even a lower percentage if we consider the condition of family related subject.
Having a judgment in family subject by a male Judge is 19,35% vs 80,65% for a female Judge: a huge difference of more than 60 point.*
As we seen in this short analysis, since 1963 women in judiciary has done a lot but the way is still long.
According to Superior Council of Magistrary’s research, female judges in Italy are still hindered from reaching leadership and semi-leadership position.
Over a total of 473 judges with leadership position, 3 over 4 are men (+71%).
For this reason is so important to improve a gender based approach in data analysis and related fields.
It helps to reach out knowledge about real situation of gender gap and equal opportunity for women in political, social and professional sphere.
*We consider the following data:
P(F) = 59%
P(M) = 41%
P(Family | F) = 34,79%
P(Family | M) = 12,01%
P(Family) = (34,79 x 0,59) + (12,01 x 0,41) = 25,44%
Then we calculate the probabilities applying the formula:

P( M | Family ) = ( 12,01 x 41 ) / 25,44 = 19,35 %
P ( F | Family ) = ( 34,79 x 59 ) / 25,44 = 80,65 %

